Written by Kaleigh Wells
Our annual FranConnect Franchise Sales Index Report features real-world data culled from our brands spanning across the franchise platform. After an eventful yet encouraging first half of 2021, for the first time ever we are looking at the data mid-year for an in-the-moment view on the state of franchise development. This data offers significant insights for franchisors looking to grow and develop their franchise brands and make the right sales and marketing investments. Peering into the data of how franchisors handled the first half of the year reveals some promising signs. It may be too soon to say, but it seems that most verticals are showing improvements on key metrics. In this post, we will share some of the high-level findings, and give you access to a webinar where the report’s author, Keith Gerson, will break down everything you need to know.
Average Monthly Deals by Per Brand by Industry | Jul – Dec 2020 / Jan – Jun 2021 (YoY)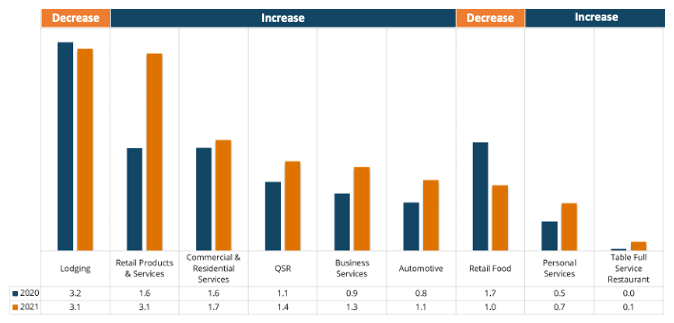 In terms of franchise deals closed, the new year is bringing positive change to most industries, apart from lodging and retail food. This is a stark contrast to last year, where the overall number of deals fell and the time to close deals lengthened – not surprising amid the uncertainty that 2020 brought. With state governments easing pandemic mandates and restrictions, Retail Products & Services saw the most noteworthy change, almost doubling its monthly deals this year thus far. Both Personal and Business Services, as well as Automotive, saw increases. Looking to the last half of 2021 and early 2022, Lodging will be an interesting category to watch as the increase in travel could lead to growth in franchise development.
Lead to Deal Conversion Rate by Segment (Number of Locations) | Jul – Dec 2020 / Jan – Jun 2021 (YoY)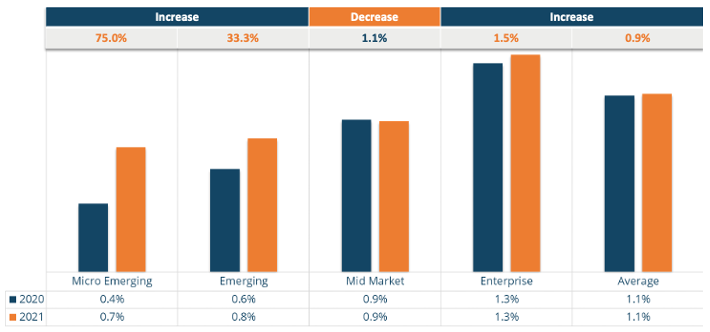 The win-rate shown on this graph shows us a small uptick in the Enterprise (201+ locations) segment, but what is most important to note here is that smaller brands are trending more effective at closing deals in the first half of this year than ever before. Micro Emerging (1-10 locations) and Emerging (11-75 locations) segments increased at a dramatically higher percentage than others – inching them closer to levels that we see for Mid-Market (76-200 locations).
Top 10 Sources for Lead to Deal Ratio | Jul – Dec 2020 / Jan – Jun 2021 (YoY)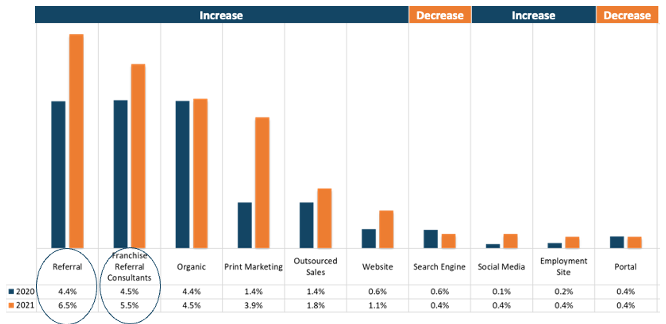 This graph compares the lead to deal ratio from the last half of 2020 to the first half of this year. While Referrals can be the most cost-effective source due to their conversion rates and remain high, they are the most challenging source in terms of scalability. In addition, finding ways to put marketing dollars towards Referrals often doesn’t secure a great ROI. This graph implies that you can confidently allocate some spend with Franchise Referral Consultants (commonly referred to as Brokers). Broker-sourced leads convert to deals at the highest rate of any paid marketing channel – and their performance improved considerably year over year. As with past years, Portals generate a huge volume of raw leads, but these leads typically do not convert to deals at anywhere near the rate of other channels.
If you are looking for more insights on the mid-year update to our Franchise Sales Index – view our recorded update webinar where Keith Gerson navigates you through the pressing changes in the franchising industry.


 Ian Walsh